
Here are some key points:
- At the height of the COVID-19 pandemic shippers were in desperate need of containers. Now, some ports have seen a decline in bookings and have a container surplus.
- Most news outlets report that this is due to a decrease in demand but the data points to things returning to pre-pandemic levels.
- US Retail Sales point to stronger consumer spending in in the third quarter and through the end of 2022.
Are major news outlets giving us the full picture?
According to some news outlets (CNBC, Jalopnik) global supply chain trends have flipped compared to 2021, and container prices continue to fall. The number of empty shipping containers at ports and container depots around the world are a sharp contrast to the previous container shortage over the past 2-years. According to CNBC this is due to a decline in demand for goods added with a looming recession and inflationary price increases.
Normally during this time of year shipments ramp up to make sure consumer demands are met, but according to CNBC, containers are sitting empty. They report, “stores seem timid on ordering more goods as their stocks are already full enough to benefit some shoppers with discounts on goods that have been sitting for a while.”
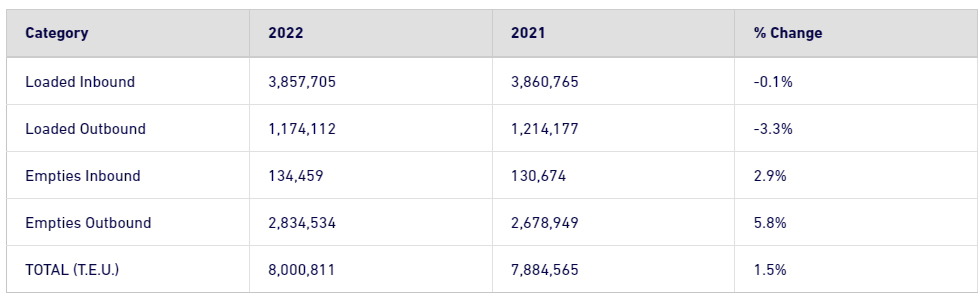
Some container yards are having a difficult time as the Port of Los Angeles is reporting a 25% decrease in container volume and Long Beach showing -15.6% compared to October of last year. These two are usually the busiest ports in the U.S. usually handling close to 20 million TEU’s per year between both.
Port of Los Angeles- YTD as of October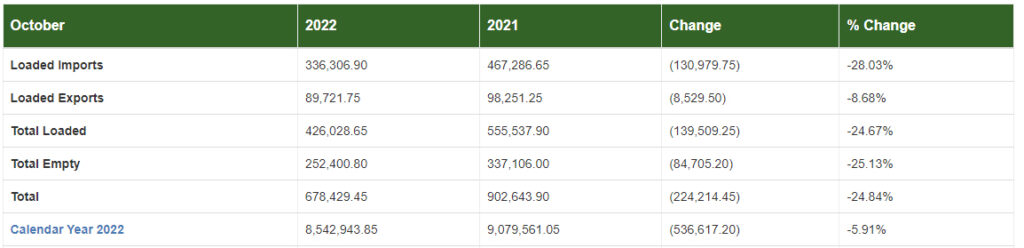
Port of Long Beach Stats- YTD as of October
Twenty-Foot Equivalent Units (TEUs), a standardized maritime industry measurement used when counting cargo containers of varying lengths.
Interestingly, The Port of New York/New Jersey is reporting an overall decrease of 0.5% in total TEU volume compared to October of last year and Savannah is reporting a 2.5% increase from the month of October year over year.
Port of New York/New Jersey – YTD as of October
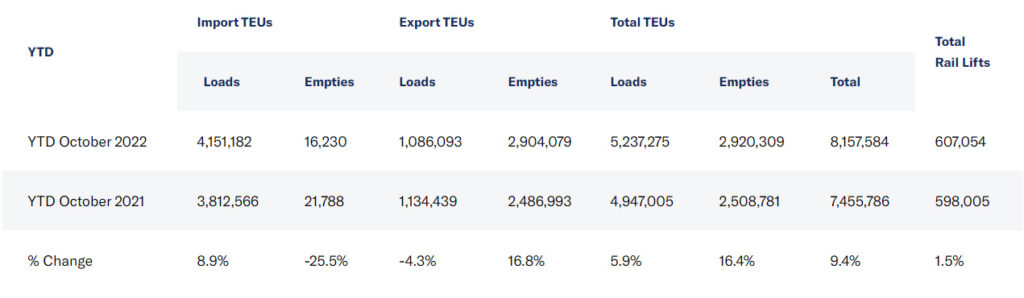
Overall, Los Angeles is down 5% YTD for 2022 when compared to the calendar year of 2021, Long Beach is showing +1.5%, New Jersey is showing almost a 10% increase in total TEU’s and Savannah is showing an increase of almost 6%.
All four are showing increases in empty containers which point to the extra containers used during the height of the pandemic era shopping spike now sitting empty in ports or container yards.
Consumer Spending and “looming” recession
While it is apparent that we are no longer in the post pandemic shopping boom when consumer spending spiked and supply chain issues compounded materials supplies, it seems like we are possibly not looking at “dark times” as claimed by the CAx which is the Container Availability Index created by Container xChange.
Container Xchange, a firm funded by private equity that leases, trades, and sells containers online while also providing data flows of tracking containers around the world says, “these trends are projecting dark times ahead for the retail industry. As 2022 winds up, falling demand is reducing 50% of the potential market. Some retail customers have seen 90% fall in their volumes,” in their November 2022 monthly report. Many of the news outlets reporting on this story used data from this report to paint a dark picture of the coming months.
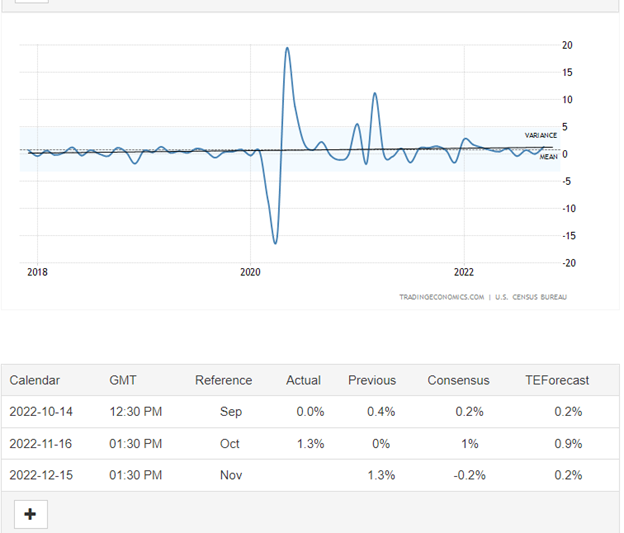
The stats for U.S. retail sales seem to be performing better than the report from CAx leads on. According to Trading Economics which show that while retail sales are down from the spike in January, they have been leveling out to pre-pandemic norms and actually were on the upswing from September to October while remaining steady for November. The chart below shows the big low, followed by a large spike during Covid and the following lock-down in 20/21, but also seems like we are returning to pre-pandemic norms which as you can see carried far less variance than the past two years (2020-2021).
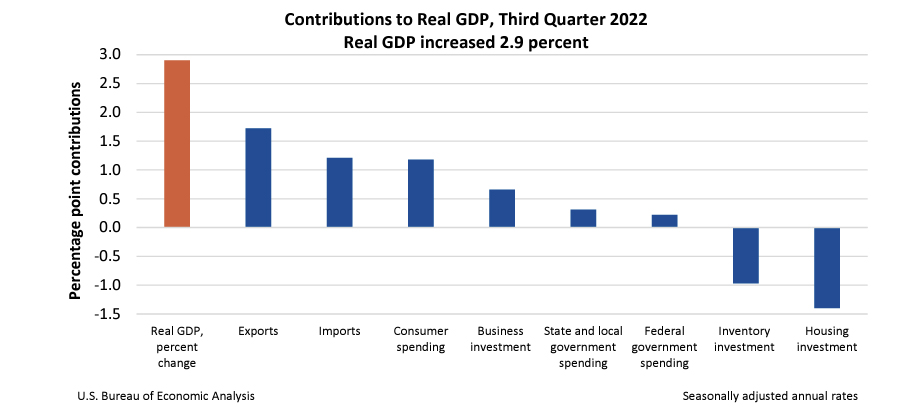 Trading Economics says, “retail sales in the US surged 1.3% month-over-month in October of 2022, the strongest increase in eight months, after a flat reading in September and beating market forecasts of a 1% gain.” This makes sense as we saw the US economy see it’s first growth in 2 quarters and reflected increases in primarily exports and consumer spending while being offset by a decrease in housing investments.
Supply Chain Management Issues
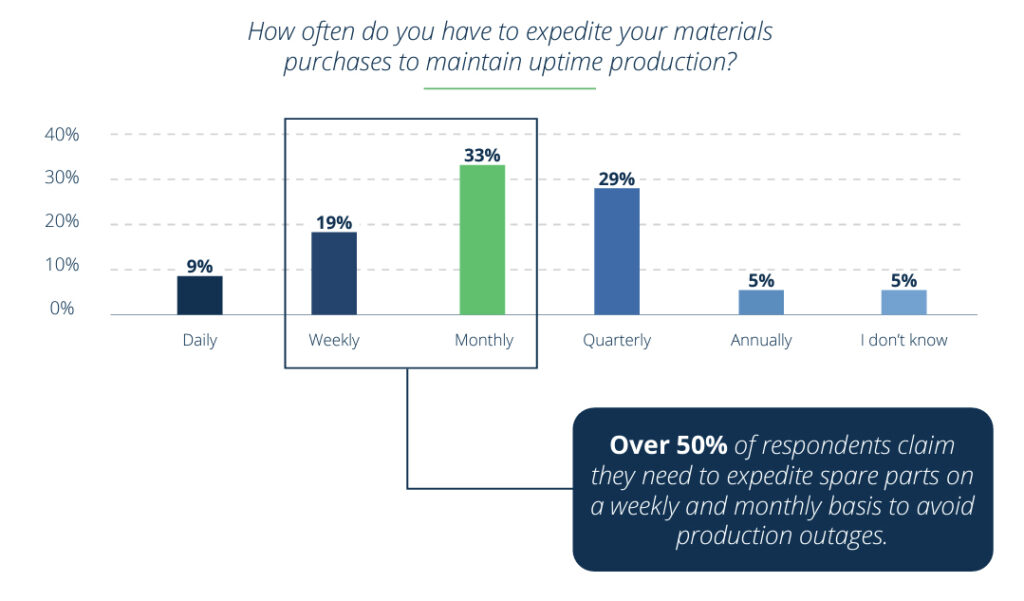
The ‘2022 State of Supply Chain Management’ survey by Verusen was conducted with leading global supply chain executives based within companies and found that the main hindrance to forecasting their business is being able to digitally track movement of materials within their networks. 76% of execs claimed they felt they had a lack of knowledge of correct reporting.
Companies are unable to gain access to clear and concise reporting for materials management which means that they feel they do not have a suitable strategy in place to adapt to unplanned downtime occurring from material shortages. This unfortunately leads to over 50% of the respondents claiming to need to expedite spare parts on a weekly and monthly basis to avoid production outages.
Data management will be a key in providing accurate forecasts and ¾ of the respondents believe that it would take between 1 and 2 years to implement an A.I. driven solution. Given these things, there are still 38 percent of respondents who have not changed their long-term strategy and 34 percent are overstocking on purpose to prevent unplanned downtime.
Why are shipping rates falling?
Prices of containers during the past two years were at all-time highs and freight forwarders and shipping companies bought as many containers as possible at that time out of fear that there would be shortages. Now, as we are almost in 2023 and things are normalizing, this has caused a surplus in container availability.
Supply chain restraints have also been easing and the price of both air freight and ocean freight have dropped dramatically over the past year. This could show that things are returning to normal (pre-pandemic). Because of supply chain issues including maritime delays, strikes and ocean container availability, more retail businesses were opting to have their products shipped via air but as supply chain woes have eased more retailers are opting to ship via ocean. Average prices for 40-foot containers are down roughly 100% compared to last year.
What does this mean for the freight industry?
It’s looking like things are returning to pre-pandemic norms. Container prices are coming down from their all-time highs and consumer spending remains level even while combating inflationary prices on goods.
Conclusion: Having an expert in your corner…
The ongoing supply chain disruptions and unclear data have led us to know how important it is for companies to show initiative around large scale improvements in digital data solutions.
Another thing that we have recognized is the fragility of the supply chain for many companies and reports have shown that over 1/3 of companies still haven’t taken any steps to improving their own methods or hired a 3rd party company like GLC Inc to manage their supply chain.
We are always keeping a close eye on all-things freight/shipping and have access to some of the best shipping networks in the world to provide the most cost-effective solutions. If you need a partner in your supply chain, we are here to help!
Please fill out the form below to request a quote.